
Objective:
In this article we will be talking about how you can figure out which products are seeing the highest rate of growth or churn over a period of time. We will explore the following topics:
- What fields you need to be sure are coming into Core iQ before successfully running the Growth & Churn Report
- How to run the Growth & Churn Report correctly in order to find the areas of fastest growth and loss at your financial institution
What fields do I need to be sure that I have coming into Core iQ for the Growth & Churn report?
For the Growth & Churn Report, there are only a few fields that you need to be sure are consistently coming into Core iQ. Because this report runs off the Open Date and Close Date for any given account, you need to make sure that we are receiving both of these dates. If you have certain accounts that you are not providing a Close Date for, they will not function correctly in this report. We measure the growth rate on your products using the Open Date for that account, and the churn rate is calculated using the Close Date for the account. You also need to be sure that we are receiving Closed Accounts, as these will obviously include items that will factor into your churn rate. If you find that we are not reliably getting these fields and you would like help mapping these items in, please reach out to our Support Team.
How does the Growth & Churn Report work?
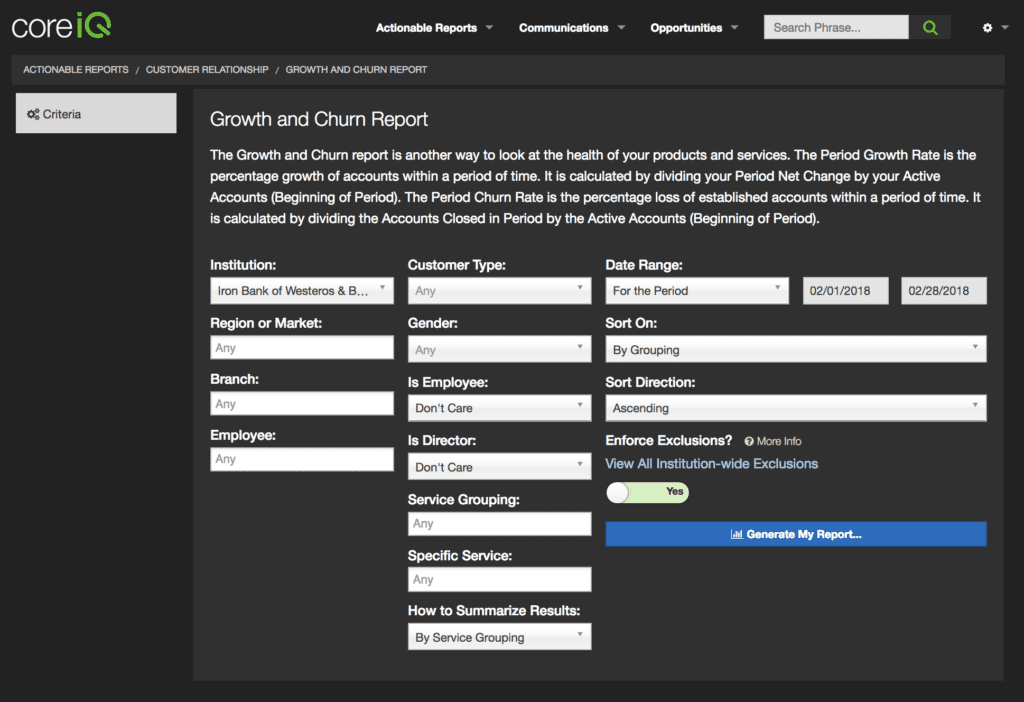
This report operates in a very specific way, so it’s important to understand the Date Range settings in order to properly pull data. Within the Date Range, you will see that there is only one option, ‘For the Period’. This range will need both a start date and an end date to function properly, and will always default to the previous month’s first and last days. The Date Range field controls where Core iQ looks when starting and ending any periods of growth and churn.
Whatever date you set as the start date within this range will control the Active Accounts (Beginning of Period) metric. This metric is a calculation of the total number of Active Accounts that you had as of the start date for the range. These Active Accounts must have an Open Date that is before the report’s set start date.
If any of those Active Accounts close during the period that you have set, they will be added to the Accounts Closed in Period metric. This metric measures the number of accounts that closed during the period, but only uses accounts that were Open as of the start of the period. This is to remove false positives in which accounts are both opened and closed during the period. If, for example, someone opened and closed their account within a single week that falls within your date range, they will not be counted in this metric.
The end date for your range will be what is used to control the Active Accounts (End of Period) metric. This is a measure of the number of Active Accounts as of the end of whatever period you set. The Active Accounts (End of Period) metric will show you the total number of Active Accounts that you have for each row in your table.
We use the metrics listed above to give you the final three columns of the report:
Period Net Change – the difference between your starting Active Accounts metric and ending Active Account metric.
Period Growth Rate – the percentage of increase over the course of this period. This is calculated by taking your Period Net Change and dividing it by your Active Accounts (Beginning of Period). This Growth Rate can be either positive or negative, depending on your Net Change metric.
Period Churn Rate – the percentage of loss over the course of this period. This is calculated by taking your Accounts Closed During Period and dividing it by your Active Accounts (Beginning of Period).
If you haven’t done so already, I would suggest digging deeper into your product-level growth and churn by running this same report using the ‘By Specific Service’ option set on the How to Summarize Results dropdown. This will give you a view of each product code within Core iQ, and will calculate the Growth Rate and Churn Rate for each. Using this setting, you should be able to directly identify the products that are leading to the highest growth rates and churn rates.
With these metrics, you should be able to clearly see where your highest levels of expansion are, as well as where you are losing the most customers over the period of time you established. Using these metrics to evaluate internal processes and product offer details can help you stem the tide of attrition at your bank or credit union. Run this report monthly to assess whether your efforts are positively affecting both your growth rate and churn rate on the products that matter to you.