We’re marketers, so we’re sending out campaigns and that is great. But at some point, someone, usually in an operational role, is going to ask how effective our communications are at driving action.
In particular, how effective are we at getting people to do things that either generate revenue or increase engagement.
It’s always been easy to figure out how much you spent on a given campaign. Just add up the number of communications sent out and multiply it by the cost per communication. One hundred emails at $.01 per email equals $1.
But, what if it could be just as easy to calculate your cost per conversion?
It can.
Find Conversion Costs with the Outbound Communication Status Report
Open the Outbound Communication Status Report. This report is designed to allow you to identify conversions associated with any template you’re sending out, whether those templates are coming from automated communication schedules or one-off campaigns.
![]()
Template Dropdown – After you open the report, you’ll notice that you’re able to select any template in your template library in a dropdown menu. This serves two functions:
- It allows you to see conversions associated with any of your communication templates
- It allows you to identify the actual people who converted after receiving an offer.
Status Dropdown – There’s a lot of flexibility with this dropdown menu as well. I’ve added a few examples below. For the purpose of this post, we need to select the “Processed” status. Please note that the “Past Due” and “Failed Processing” status will not provide conversion data.
- Status = Processed – Select this from the dropdown menu if you’re interested in learning which of your communications converted. When you pull this report, you’ll also be able to learn more about the individuals who converted after receiving the offer.
- Status = Past Due – Select this from the dropdown menu if you’re looking for employees who have not pushed out communications that have been assigned to them. This is a great way to keep an eye on outbound pho
- Status = Failed Processing – Stay abreast of the communications that have not been sent out, and learn more about why that happened.
Date Range Dropdown – You have a couple of options here, but for the purpose of tracking conversions, you’re going to want to select the “Conversion Date” option from this dropdown menu.
After you’ve selected the appropriate dropdowns, click “Generate My Report”, and from here, you will be able to export the data from your report to Microsoft Excel or a .CSV file.
Getting to Cost per Conversion
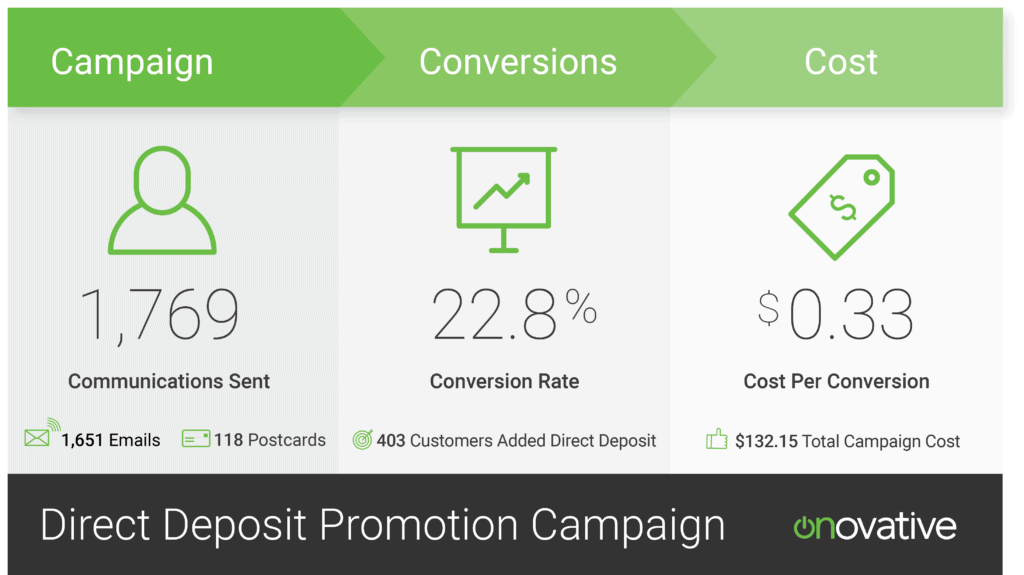
From here, you just need to capture a couple of counts, and you can calculate your cost per conversion as well as your conversion rate… so that you can make one of these nifty graphics to pass up to leadership and get that promotion you deserve.
Template Count – This data is located in either the “Template Composition” tab or the “Communication” tab. It tells you how many templates were sent.
Template Cost – This data located in either the “Template Costs” tab or the “Communication” tab. It tells you how much you spent on a given template. It’s a best practice to come up with a template naming convention that helps make it easy to find the template you’re looking for later, in the data.
Conversion Count – This data is located in the “Communication” tab. It tells the number of templates that converted, or how many people opened an account, were approved for a loan, etc.
Mathing It All the Way to Cost per Conversion
You’re almost home free. Now you just need to take the data that you collected above and make some new data with it. Here are the fields that you’re going to want to be able to make based on the data you now have:
Templates Sent – Get this number by adding each template count together.
Cost – Get this number by adding each Template Cost together.
Conversions – Get this number by adding each Conversion Count together.
Cost per Conversion – Multiply “Templates Sent” and “Cost”. Then take the product and divide it by “Conversions”.
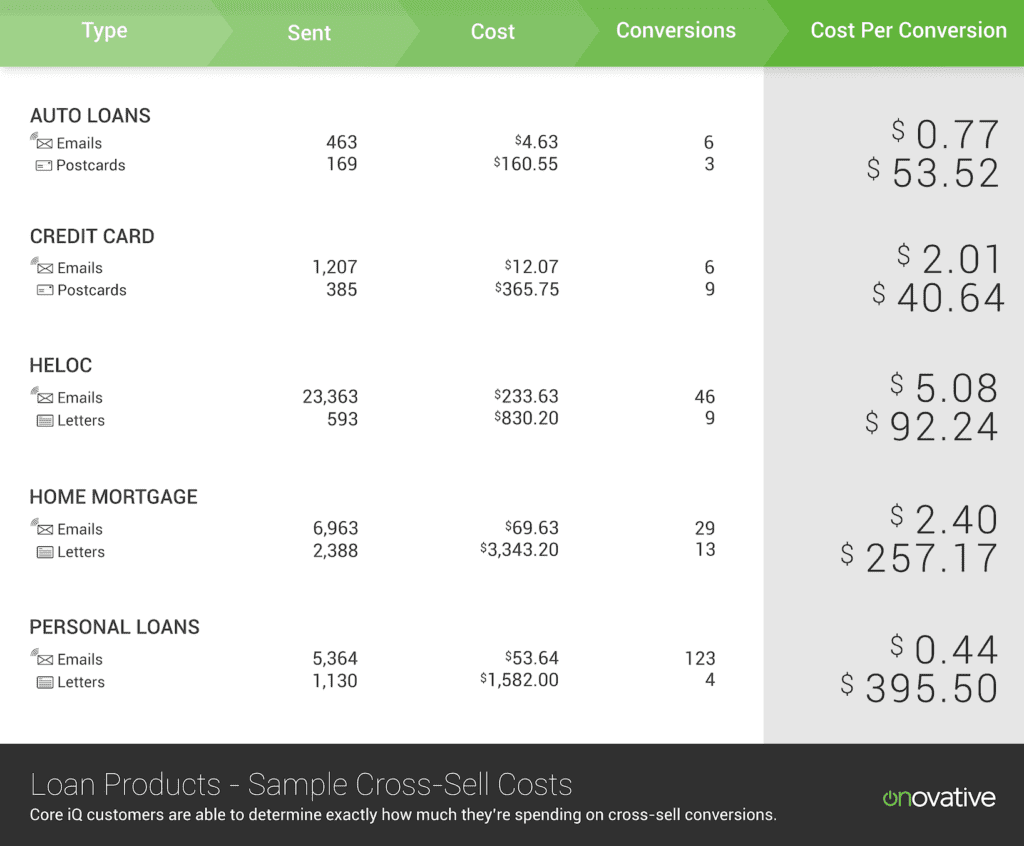
This number, Cost per Conversion, will help you identify your most inexpensive communication channels. It’s especially handy when dealing with low converting products, like auto and home loans.
When thinking about loans, your “Conversion Rate” may not be very impressive. But what can be impressive is your cost per conversion. A 2% conversion rate or less doesn’t sound that awesome…
However, being able to say that you spent less than $1 for over 123 personal loans up to $10,000, like a boss, sounds much more impressive. So, why not play around with Conversion Rate and Cost per Conversion? You may discover some metrics that will impress management.
Then bring everything together within a specific product line. Like this: